Authors: Marina Walz, Dmitry Badyukov, and Malte Hemmerich on Optimizing Energy Density for Deep Engraving
要約
Laser engraving is a widely used method for marking a variety of materials, from vehicle parts and toolmaking over electromechanics, to jewelry and watches. The laser process allows for fine structures and high flexibility in shaping the engraved design, while also enabling a contactless process. Short pulse lasers, such as the picosecond laser used in this study, enable engraving on a wide range of materials with low heat impact, making it suitable even for temperature-sensitive electronic parts. This paper investigates the impact of laser energy density (fluence) on the quality of deep engraving on steel for jewelry and watch applications, with a focus on removal rate and surface quality. Tests were performed using a 40W average power picosecond laser, varying laser repetition rate, power, and number of burst pulses. The results provide insights into the efficiency of the laser engraving process at different fluence levels.
Introduction to Laser Engraving
Laser engraving has become a widely used method for marking and decorating various materials within the jewelry and watch industry due to its high precision, flexibility, and non-contact nature. Compared to traditional mechanical engraving techniques, laser engraving provides several benefits, such as better control over the depth and width of the engraving, the color appearance of the engraved area, the ability to create more complex designs, and virtually no wear of the engraving tool. Additionally, the laser process can be optimized to not produce chips or debris, making it cleaner and less prone to damage of precious materials like metals, gemstones or ceramics.
Fig. 1. Laser engraved Novanta logo with a depth of 100µm
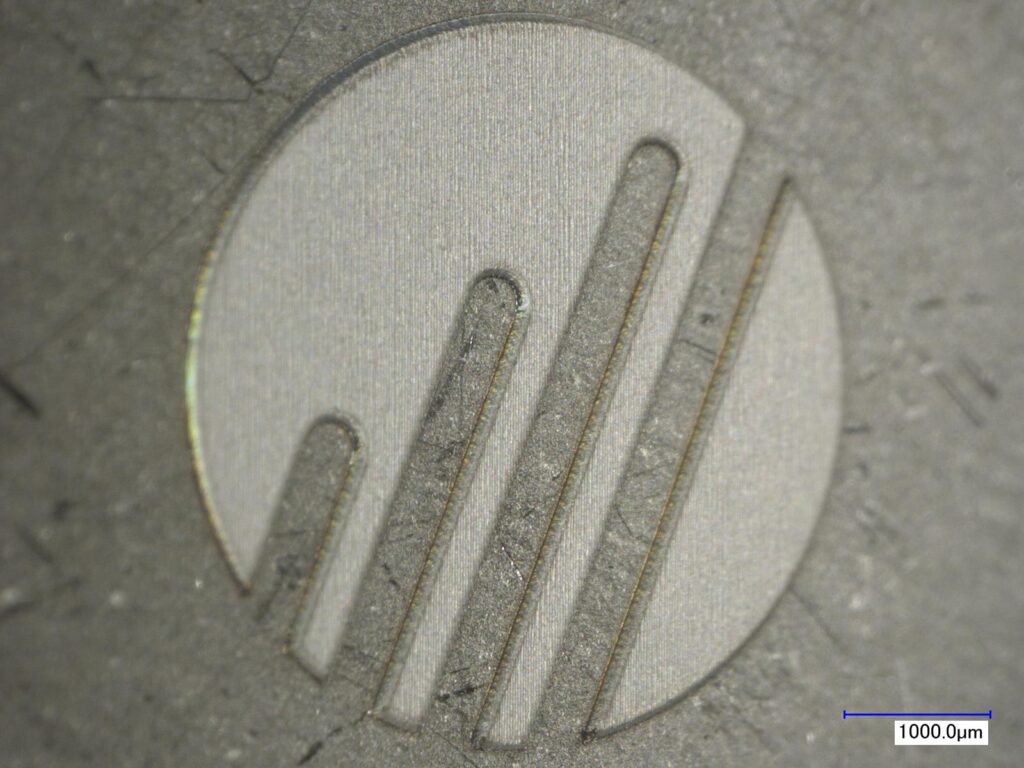
While individual application requirements in this industry vary immensely, a common request is to engrave a detailed logo with a size of 1-10mm² about 50µm deep or even up to a full millimeter (deep engraving) into a metal (see Figure 1). At the same time, the feature details of such logos often need to be in the range of 50µm and to appear with a sharp contrast from the base material. This request for high-contrast can be solved by a fine microstructure of the engraved surface in the range of 1-5µm which then selectively reflects light and therefore lets the material shine in a specific color. Typically, no post processing is desired, hence high-quality, burr free marking is required. Figure 8, towards the end of this paper shows some black, gray and white examples of these colors.
As within all industrial applications, process time and process quality matter. For this type of deep engraving application, it is necessary to achieve a good removal rate of several mm³ per minute and simultaneously create a corner radius of less than 50µm with a final surface roughness of just a few micrometers with defined structure. To achieve a sweet spot of these requirements, the laser energy density per pulse, also known as fluence, is a crucial parameter as it affects the engraving quality, removal rate, and surface roughness. Therefore, the optimization of the fluence is essential to achieve the desired engraving results in terms of removal rate and quality. This white paper aims to investigate the effect of laser fluence on the quality of deep engraving on steel using a 40W average power picosecond laser.
Setup and Tests for Deep Engraving
Equipment
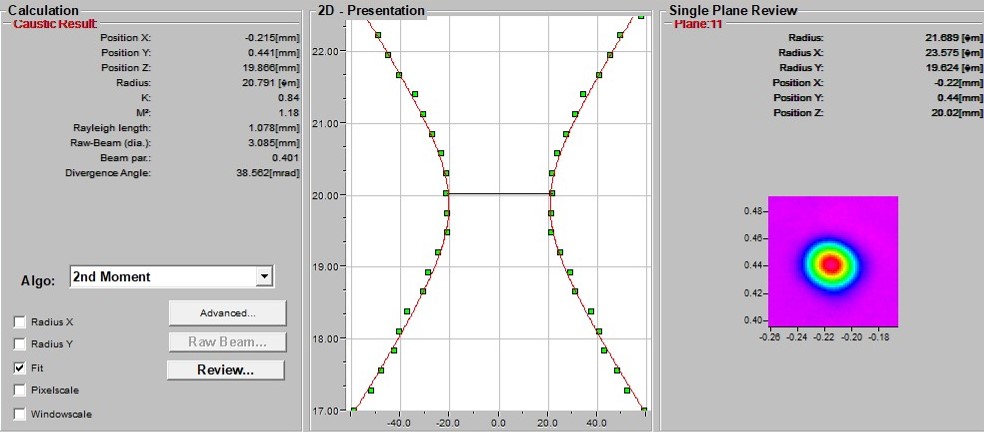
The Laser equipment used for this study are a picosecond laser (λ = 1064nm, Pmax = 40W at 1MHz, pulse duration = 8ps) in combination with a Novanta Squirrel, 11mm analog 2D scan head equipped with a telecentric F-Theta lens with a focal length of 80mm. The resulting beam caustic was analyzed with a Primes MicroSpotMonitor, which measured a focal diameter of about 50µm and a beam quality of the entire setup of M² = 1.18 (see Figure 2).
Fig. 2: Caustic measurement
For the analysis of the created test samples a KEYENCE VK-X210 laser scanning microscope and a KEYENCE VW-9000 High Speed Microscope were used to identify the surface roughness (Ra) and the engraving depth.
Laser Parameter and Test Pattern
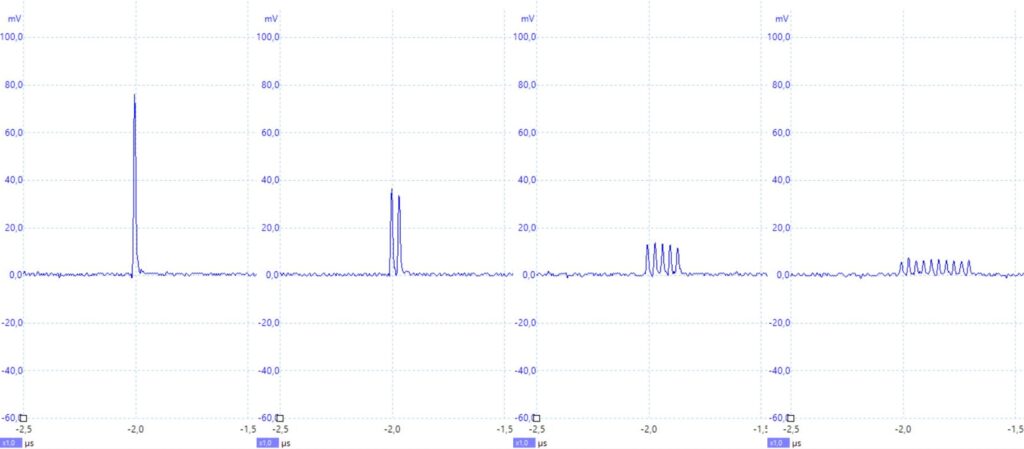
To keep the parameter range manageable, the following laser parameters were varied: laser repetition rate (1000kHz and 200kHz), laser power (100% and 50%) and number of burst pulses (1,2,5,10). At a pulse repetition rate of 1000kHz, a pulse energy of 40µJ is delivered resulting in a maximum fluence of 3J/cm². Using just 50% of power the fluence decreases to 1.6J/cm². Changing the laser frequency to 200kHz results in a roughly four times higher pulse energy delivered by the laser (170µJ). Therefore, the resulting maximum fluence is 12J/cm² at 100% power at 200kHz. Additional levels of fluences beside those at 100% and 50% are generated by inserting the burst mode of the laser with 1,2,5, and 10 pulses per burst (see figure 3). This way the pulse energy is split up into the number of burst pulses leading to a decreased fluence value. In total the pulse energy stays the same within a single burst. The series of burst pulses is emitted at the seeder frequency, which is 30MHz.
Fig. 3: Visualization of Burst-Mode with 1, 2, 5 and 10 pulses per bust
A simple square with edge length of 3mm x 3mm was chosen as a test pattern which is filled by lines of a defined hatch distance. In the first tests the number of passes is limited to 10, later that number will be extrapolated to a depth of 100µm. For the purpose of comparability, the marking speed was fixed at 1m/s.
Results
Within the first series of tests the achievable removal rate and surface roughness is examined after 10 passes of the defined hatching pattern and with all combinations of laser parameters previously described. This step is extremely important as too high of a surface roughness cannot be compensated for in the final surface structuring step.
Removal Rate
The removal rate is defined as the volume, which is removed per time unit, here in mm³ per minute. This criterion allows a comparison of all different laser parameters of the test series and provides information on the efficiency and process speed.
Fig. 4. Diagram of the resulting removal rates at the investigated laser frequencies. The data points are marked with the number of burst pulses.
Figure 4 shows the removal rates of the different laser settings as a function of the resulting fluence. Comparing 100% of average power with 50% at 1000kHz (blue) the removal rate is in a range from 1.4mm³/min to 3.5mm³/min. At the lower repetition rate of 200kHz the values range from 0.8mm³/min to 3.7mm³/min. At 1000kHz and 50% laser power the removal rate first increases at lower fluences, reaches a maximum, and then decreases again. At 200kHz the same behavior can be assumed but is not visible in the data generated. Overall, there is evidence that fluences of 1J/cm² or more, lead to a decreased removal rate. The physical background of this behavior is out of scope of this paper.
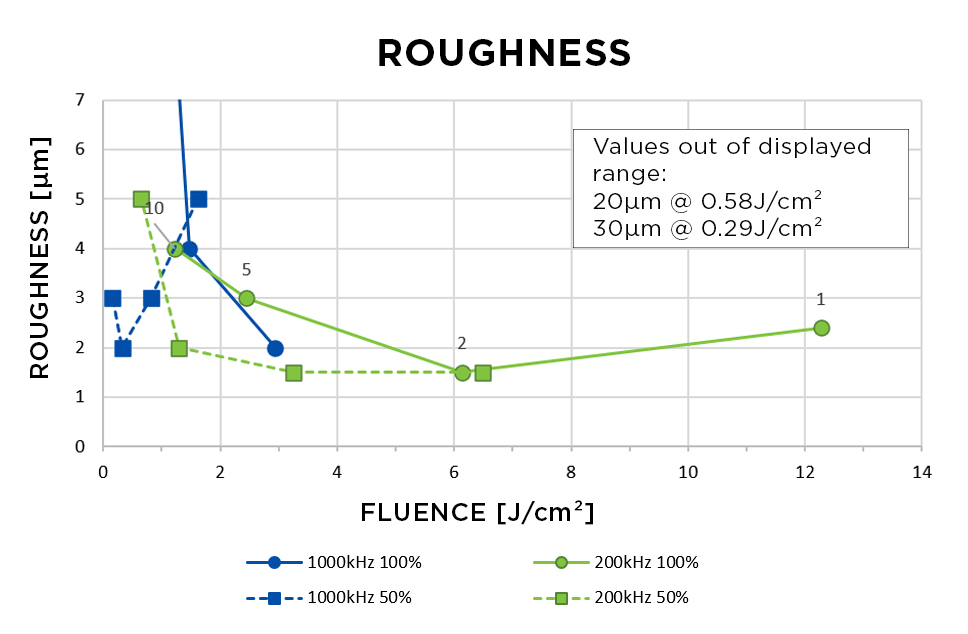
Surface Roughness Ra
The second evaluation criterion is the surface roughness Ra (Roughness Average), which provides insight into the quality of the machined surface. In this study, achieving a very smooth surface is crucial as it aligns with the target market’s requirements of typical 2µm or lower.
Fig. 5. Diagram of the measured surface roughness Ra. The data points are marked with the number of burst pulses.
The surface roughness as a function of the fluence is presented in Figure 5. The measured surface roughness falls within a range of 1.5µm to 5µm, with an extreme of up to 30µm for the combination of 1000kHz and 100% laser power at high numbers of burst pulses. It can be assumed that this is a result of a high pulse overlap and strong melting of the material, that causes the melt to solidify in a random peak and valley structure, leading to increased surface roughness. To mitigate this issue, increasing the scanning speed can help, while this approach is not part of the current study. Overall, the graphs indicate that the surface roughness is heavily influenced by laser and scanner parameters, emphasizing the importance of finding the optimal set of parameters to achieve the desired smoothness.
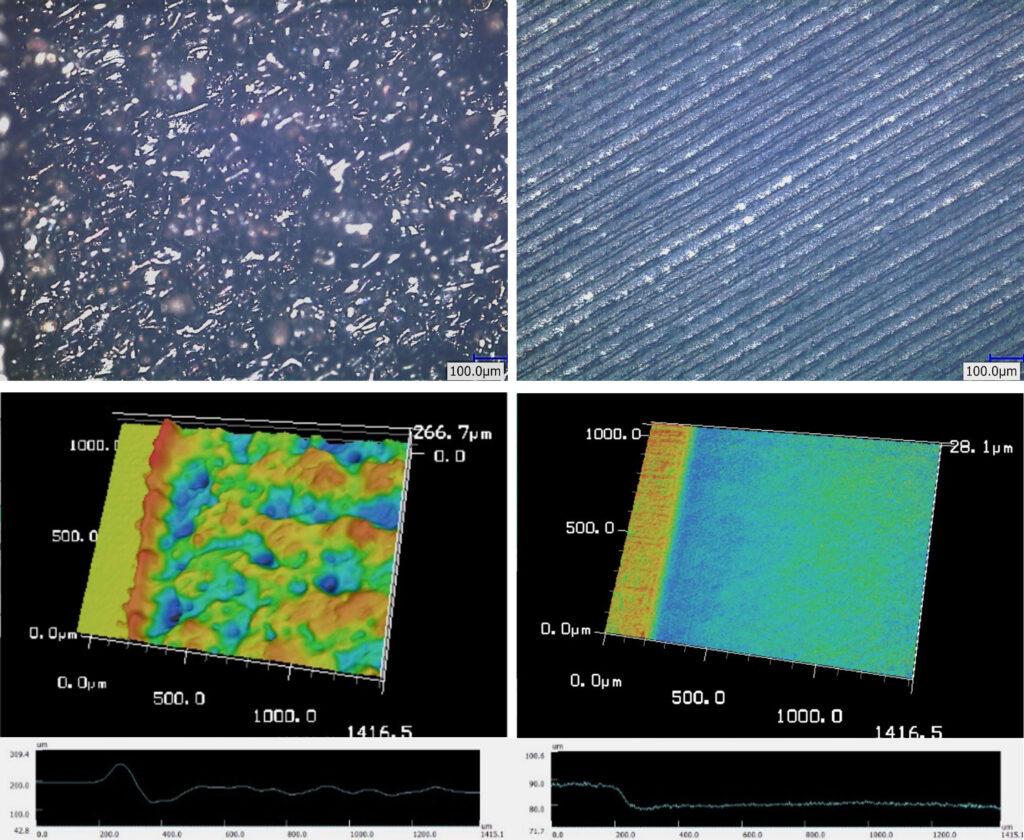
Figure 6 shows images of the worst and best result of surface roughness. The left images represent the extreme value of 30µm of roughness achieved at 1000kHz, that leads to a random peak and valley structure with a high burr at the edge. The other example shows a smooth surface with a roughness of 1.5µm. There is also a smooth transition on the edge of the machined surface without burr.
Fig. 6. Laser scanning microscope images of processed surfaces representing the worst and best result. Left at 1000kHz, 100%, burst 10, and right at 200kHz, 50% and burst 2.
Deep Engraving up to 100µm
For deep engraving more than the initially tested 10 passes are required, which has a further impact on the resulting surface roughness. While the removal rates at 100% and 1000kHz are very good, the generated surface roughness is unacceptably high to achieve the required surface finish. Therefore, the parameters at 200kHz provide the best ablation rate and quality combination which are used for further tests with more passes and higher engraving depth.
After the preliminary tests, the number of repeats required to achieve a 100µm deep engraving was extrapolated linearly for each fluence setting and is between 20 and 120 passes.
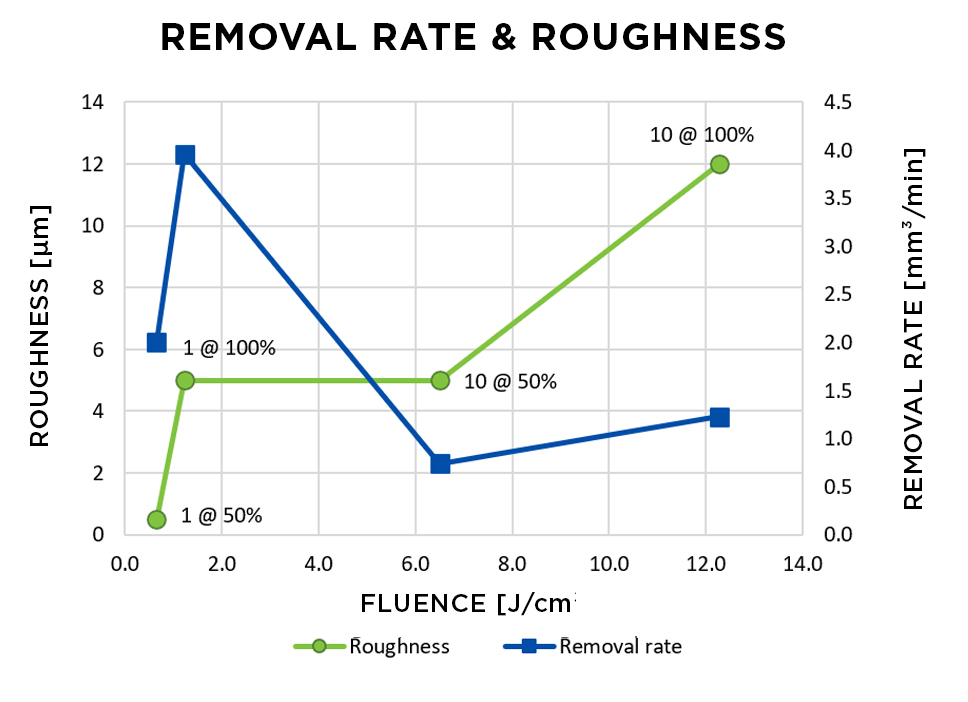
In figure 7 the removal rate (blue) and surface roughness (green) are both shown as a function of the fluence at a setting of 200kHz and 100% and 50%. Similarly as before, the lowest fluences are achieved by applying 10 burst pulses, while the higher fluences are achieved with a single pulse.
Both criteria, roughness, and removal rate, show better results at lower fluences, except the lowest fluence in this test series. The removal rate got its maximum peek at a fluence of 12J/cm², but the corresponding roughness of 5µm is comparatively high which is often not acceptable.
Fig. 7. Roughness and removal rate at four fluence settings at a requested depth of 100µm
Finishing Color
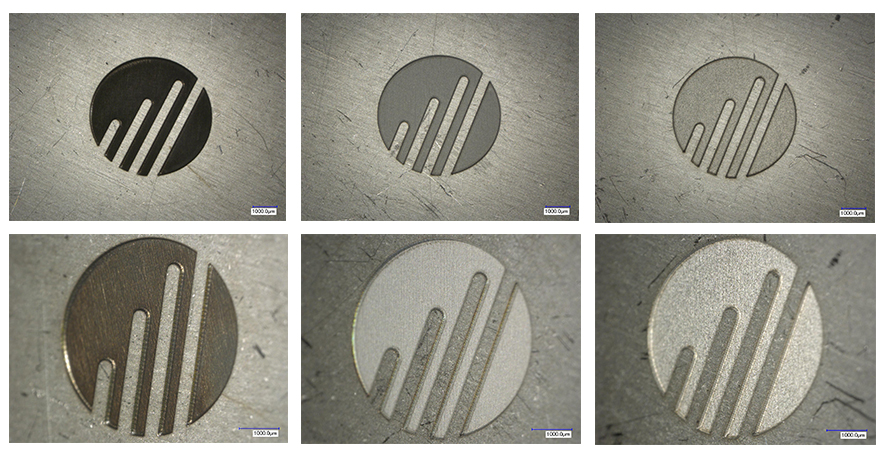
For jewelry and watch industries, the customer often wants to have a certain appearance, like black, white, opaque, or shiny. All of these can be achieved with an additional finishing step after the requested depth is reached if at this point the surface roughness is not too high (Ra < ~5 µm).
By adjusting laser power and pulse overlap, the surface microstructure is manipulated which creates a certain macro appearance. As this requires even finer surface structures than before, a fluence of 0.6J/cm² is used for the following color schemes.
Fig. 8. Novanta logo with different color finishes: black, gray frosted, white (bottom row presents tilted view).
The preceding engraving step creates a smooth surface with a roughness of 0.5µm. After finishing the surface, the roughness ranges from 1.7µm to 2.0µm, depending on the requested appearance.
結論
In this study, we investigated the laser ablation process of stainless steel to achieve high-quality surface structuring for jewelry and watch applications. We analyzed the effect of laser and scanner parameters on the removal rate and surface roughness of the machined surface.
The results on this paper show that the fluence is a critical parameter for achieving high-quality surface structuring. However, both criteria do have specific individual optima within the fluence curves that depend on the various laser, scanner and material combinations. It is further shown that the process is limited by quality, and not by average laser power. Therefore, process improvements can usually not be achieved by higher average power lasers unless the scanning system can provide much higher speeds at equal accuracy. However, the tests performed effectively show that optimization for individual laser, scanner and material combinations for specific application requirements can and should always be done. In the present case, a fluence of 0.6J/cm², applied at 200kHz, ~18W average power and 10 burst pulses was ideal to meet the required quality.
In conclusion, our study provides insights into the laser ablation process for achieving high-quality surface structuring on stainless steel. Our findings can be used to optimize the laser parameters for specific application requirements and to further develop the laser ablation process for other materials and applications.
Novanta ベネフィッツ
Novanta is uniquely positioned to solve even the most complex challenges for OEMs, system integrators, and end-use customers seeking to advance their manufacturing processes with high precision laser systems. With some of the most well-known brands in the industry and in-country application and service support, Novanta delivers reliable, precise, and durable components and sub-systems.
Our Applications Testing Labs offer application and proof-of-concept testing to OEMs, system integrators, material manufacturers, processors, and end-users of automated machinery. Novanta Application Engineers are laser processing experts, and understand the parameters that will ensure successful, efficient laser processing. Using laser and beam steering equipment from well- known Novanta brands, our Application Engineers will determine the key product parameters and processing know-how to achieve the desired results.